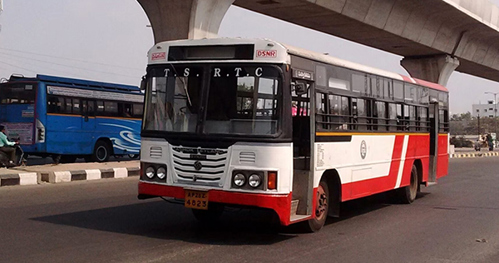
TSRTC Analysis

IIDS
Telangana State Road Transport Corporation (TSRTC)
Project Title:
Identify and optimize ways to improve the overall revenue across products and regions was signed on the 24th of January 2023
Purpose:
The project aims to identify and optimize ways to improve the overall revenue across products and regions. Also, it provides necessary day-to-day metrics to monitor and make data-based decisions at the depot level.
Project and Data Description:
The initial sample data set consisted of two versions: Cumulative data at the service level and Individual Ticket sales data from TIM machines. Data was collected through TIM (Ticket Issuing Machine) and was periodically synced with the server after completion of service (i.e., bus/product leaving from the origin point, reaching the destination, and returning to the origin). The data sample was collected over one month (June 2022), including customer-wise ticket data, current stop, destination stop, transaction value, ticket type, bus, travel, and other bus/journey-related markers.

Current Analysis/Methodology and next course of action:
The team tried to demonstrate the metrics to identify the non-profitable services by creating an adjacency matrix of individual services to the finest level. We establish and study the relationship between these metrics and profitability at various levels/cuts of the data. Next, we identify/create break-even points for these metrics using cost data for decision-making at multiple levels. We provide them with an action matrix to identify the gaps and suggest a course of action. The next step in the project is to collect data across regions for a more extended period from the organization to build a better model.
Interaction with the organization:
During the project, the TSRTC team interacted with the research teams via virtual interactions (zoom calls), TSRTC team location visits (Head office, bus depots), and field visits. Monthly interactions are scheduled to update the client and take feedback on the progress. The TSRTC team has shown interest in providing us with more data to carry out further analysis and provide them with a more elaborate solution.