#FinancialInclusion #DataInsights

Regional Rural Banks (RRBs) Making FINclusive Bharat

As of 2022, there are 43 Regional Rural Banks (RRBs) in India. Among these, 34 RRBs are profit-making and reported a net profit amounting to Rs 3219 crores in 2021-22, a rise from Rs 1682 crores in 2020-21.

In India, RRBs represent 9 per cent of the borrowers' accounts, whereas only 3 per cent of credit flow happens through loans from the banking ecosystem. The number of borrowers through RRBs was 1.86 crores in 2010 which increased to 2.68 crores in 2021 with a compounded annual growth rate (CAGR) of 4.53 per cent. The primary account holders of the RRBs belong to the rural (73 per cent) and semi-urban (22 per cent) areas. The lion's share of credit flow in RRBs happens to the agricultural sector at around 68 per cent, amounting to Rs 229,648 crores in 2021. The rural area-dominated borrowers have grown from 1.3 crores to 1.9 crores between 2010 and 2021; meanwhile, semi-urban areas have seen a surge from 43.7 lakhs to 59.3 lakhs accountholders during the same period.

#IDPInsight

How COVID-19 Impacted Petroleum Consumption 

The advent of COVID-19 in India led to several repercussions at multiple levels. From industrial slowdown to restricted public movement, every major economic activity got affected.  The lack of public movement also affected vehicle mobility. 

According to the Petroleum Planning and Analysis Cell (PPAC), the consumption of petrol (Motor Spirit) came down drastically to 973 TMT (Thousand Metric Tons) in April 2020 which was around 2500 TMT in February 2020 when the nationwide lockdown was imposed (Figure 1). 

After the 90 days lockdown period (April 2020 to June 2020), when the lockdown was lifted Government of India started the unlock phase, the consumption rate bounced back to 2,280 TMT (Figure 2) with an increased rate of around 134 percent in June 2020. 

On comparing the Petroleum Consumption with the Google Mobility trend of Public Stations (percent change of mobility trends for places like public transport hubs such as subways, bus, and train stations), the mobility decreased to -62.3 percent in April 2020 but again bounced back to -31.3 percent in June 2020 (Figure3).

By - Danish Ali Hakim, Research Associate


#IDPInsight

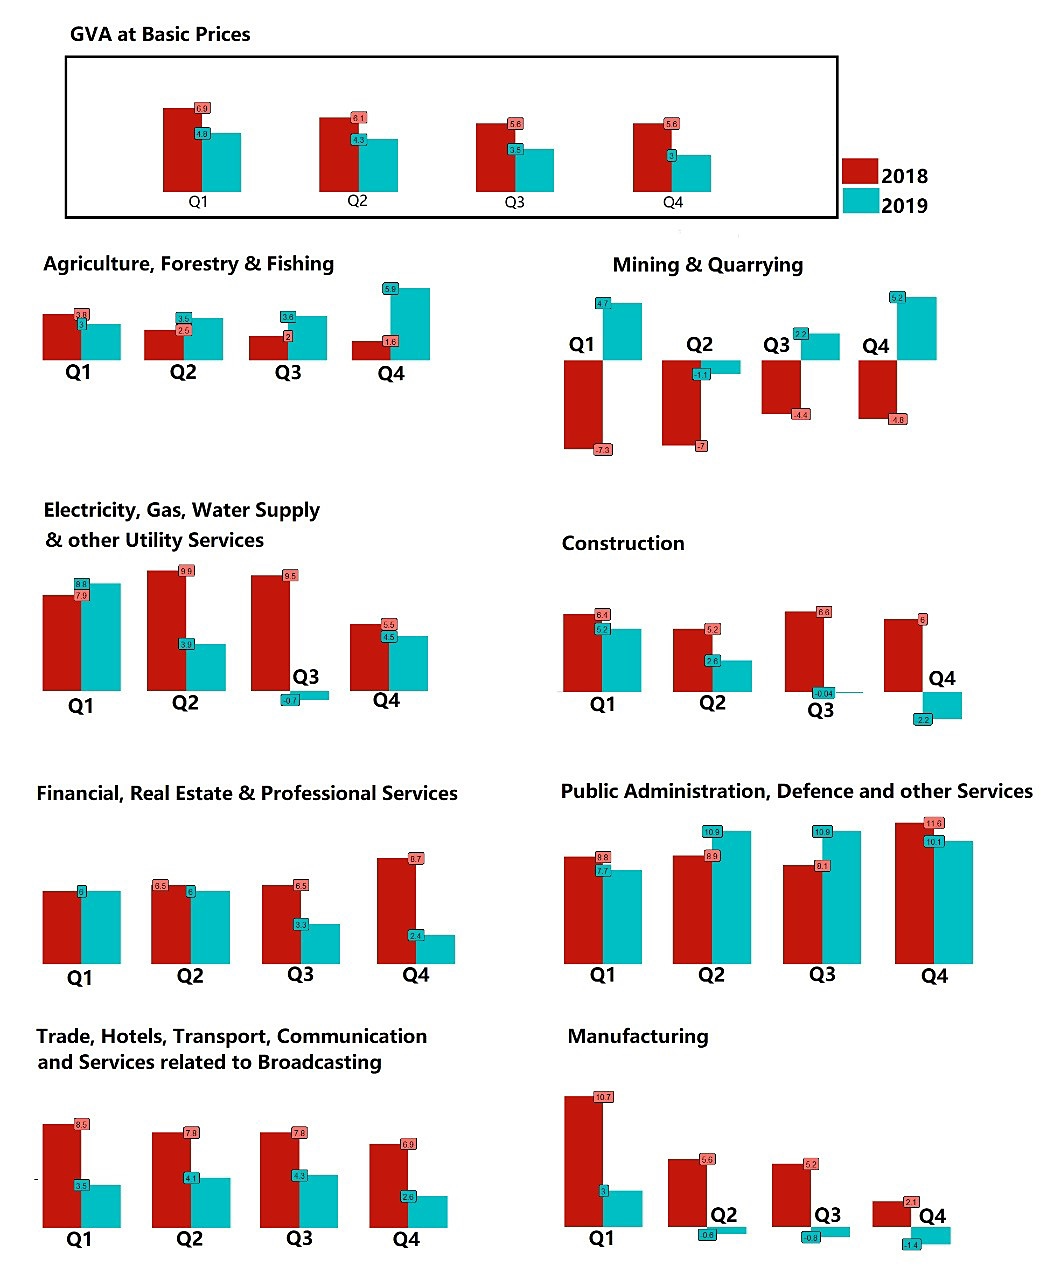
Growth and Employment

Growth and employment form a basic economic cycle. Higher growth means greater output and more income, which in turn leads to higher investment and employment generation in the economy. The rise in employment further helpsin increased output, ultimately resulting in more growth. Thus, completing the economic cycle. 

According to MOSPI sources, the Indian economy witnessed a fall in growth (GVA at 2011-12 prices) during Q1 ( -22.4%) and Q2 (-7.3%) of 2020-21, respectively. This was primarily due to the lockdown and economic restrictions caused by the COVID-19 pandemic. 

The impact of this fall in economic growth was also noticed in the employment sector. There was a contraction of the formal economy with a significant reduction in employment generation, clearly represented by indiadataportal.com (Figure). https://tinyurl.com/y6ejr6xz

According to MOSPI sources, the total number of new subscribers to social security schemes such as EPF, ESI, and NPS came down during Q1 and Q2 of 2020-21. This indicates the generation of employment in the formal sector. 

A slower rate of economic growth (recovery) was also observed in Q4 (January-March) of 2020-21owing to the second wave of the pandemic, which was reflected in the downfall of new subscriptions during this period. 

The financial year 2020-21 started with an economic slowdown. The first two quarters, Q1 and Q2, witnessed a growth of 18.8 per cent and 8.5 per cent, respectively. The higher growth could be the lower base effect however, the recovery led to a rise in the new social security subscriptions as presented by indiadataportal.com. 

By Sridhar Kundu

#IDPInsight

MGNREGA : Is it less urgent?

#MGNREGA #ruraldevelopment #employment #economy #publicpolicy

MGNREGA is designed to provide livelihood security to rural households by providing 100 days of guaranteed employment whose members volunteer to do unskilled manual work. It has become the largest public sector job creator in rural India since it came into effect in 2006.

As per the latest information, 72 million rural households have been provided work under this development program in 2020-21. However, every household does not get the prescribed 100 days of employment in a single financial year.

The historical trend shows that less than 10 per cent of households receive 100 days of employment. In 2013-14, this share was 9.7 per cent and in 2018-19, there was a minor increase in this share by 0.3 per cent.  In 2020-21, only 9.4 per cent of households who worked under the program crossed the 100-day limit.

There is a wide variation at the state level on the per cent of households working for 100 days in a single financial year. Information from IndiaDataPortal shows that in 2018-19, households completing 100 days of employment is less than 2 per cent in major states such as Punjab, Haryana, Bihar, and Uttar Pradesh. However, in states like Kerala and West Bengal, this share is about 30 per cent. 

#IDPInsight

Jharkhand Economy: Need of a strategic intervention

Jharkhand was created as a new state on 15th November 2000. The objective behind the state formation was to promote development in the region by providing additional administrative powers. Two other states were formed during this year with the development as the key objective unlike language, were Uttarakhand (16th November) and Chhattisgarh (1st November).

The state Jharkhand was created by the separation of tribal districts from the southern part of Bihar. Although more than two decades have passed since its formation, the state has not made significant economic progress. It is one of the poorest states of the country at present.

As per the latest information from Central Statistical Organisation (CSO), per-capita income (at 2011-12 constant year prices) of Jharkhand in 2020-21 was Rs.59,369, just above Uttar Pradesh (47,271) and Bihar (34,313). The national average per-capita income for this year was Rs.86,658.  The per-capita income of Jharkhand is also lower than its two contemporary states i.e., Uttarakhand (1,78,050 in 2019-20) and Chhattisgarh (Rs. 82,418).

An economy needs steady growth and a fair redistribution of the growth among its people to attend a higher per-capita income in the long run. In comparison to the states such as Uttarakhand and Chhattisgarh, the state economy of Jharkhand has witnessed a discontinuous growth process. In the past few years, during 2011-12 and 2019-20, both Jharkhand and Chhattisgarh witnessed an equal growth rate of 6 per cent per annum. However, fluctuation of economic growth in Jharkhand, as measured by the standard deviation (S. D=6) is higher than the same in Chhattisgarh (S. D=3).

The lower per-capita income of the state shows a lower level of standard of living of the people. Estimates from NSS Household Consumption Expenditure Survey 2011-12 (this is the last survey conducted by NSSO on household-level consumption expenditure), show that about 37.4 per cent of the population in the state lives below the poverty line, with over 40 per cent in the rural areas and nearly 24.8 per cent in the urban areas. 

Jharkhand is one of the richest states in terms of the availability of raw materials.  Coal and Iron ore are two major inputs in an industrial economy. Twenty-seven per cent of India’s coal reserves and 26 per cent of iron ore reserves are located only in this state. Besides having large resources, natives from the state migrate to other states in search of employment. According to Census 2011, total migration from the state in search of employment was 8.25 lakhs which is higher than the major states such as Bihar, Himachal Pradesh, and Uttarakhand.

To address the above economic issues such as lower level of per-capita income, discontinuous growth process, higher level of poverty and outflow of migration, a few areas need specific attention.

a. Although mining is one of the major economic activities of the state, above 70 per cent of the population in the state depends on agriculture for their livelihood. Agriculture and allied sectors share about 12 per cent of the state’s Gross State Domestic Product (GSDP). This shows a lower level of productivity which could be caused due to lower level of irrigation in the state. Information from India Data Portal shows that about 15 per cent of the total Gross Cropped Area is under irrigation (Figure1). Even some parts of the states such as districts like West Singhbhum, Giridih, Saraikhela have irrigated areas of less than 2 per cent. (Figure2)

b. Improvement in productivity in any production process needs skilled manpower which warrants a good education and healthcare system.  Some of the interior villages in the state still need the penetration of primary education. About 67 per cent of villages have primary schools, 31.5 per cent have secondary schools and 9 per cent of villages have access to high schools. IDP presents district-wise information on village level concentration of primary, middle, and high schools (Figure 3).

The state is yet to develop its healthcare system. Most of the villages in the interior districts in the state are yet avail basic healthcare facilities. According to Mission Antyodaya Report 2019, nearly about 87 per cent of villages do not a health centre.

c.  Absence of basic infrastructure facilities in the state create hurdles in the development process. Electricity is one of the major inputs in the production process. Micro, Small and Medium Enterprises (MSMEs) need a continuous electricity supply. According to Mission Antyodaya Report 2019, only 2 per cent of villages are having electricity supply access to MSMEs.  On the domestic front, about 83 per cent of villages are having electricity connectivity for domestic use. (Figure4).

The second important element in the fray of physical infrastructure comes as road. Road creates the path towards economic progress. Production from agriculture, industry needs a better road to get market access. Till today, about 29 per cent of villages in the state do not have all-weather roads. (Figure-5)

There is a need for a continuous effort to address the inner priorities of the state to create a platform for long-run economic development. Irrigation, road infrastructure, education, health, and electricity supply are a few important units to build an economy’s inner strength. A strategic intervention in each of these areas with limited resources in hand would make the difference. 

By Sridhar Kundu

#IDPInsight

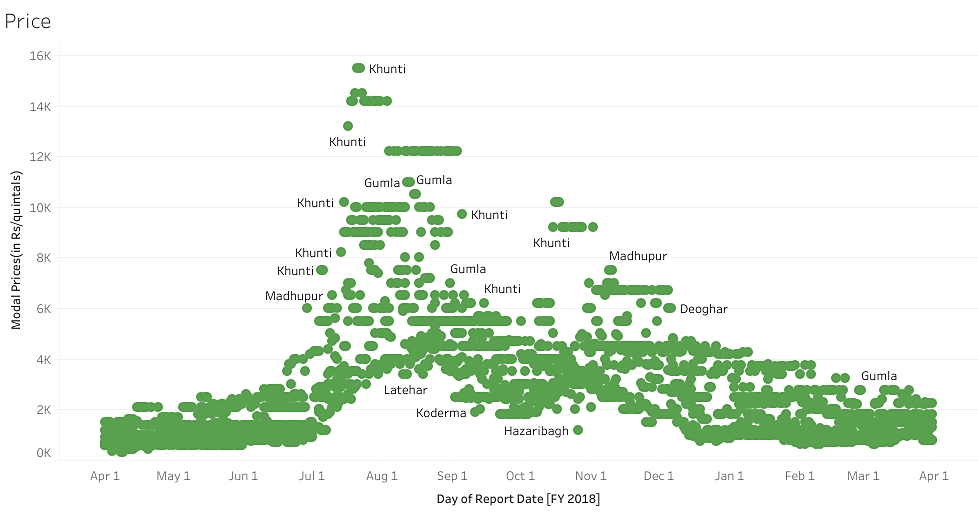
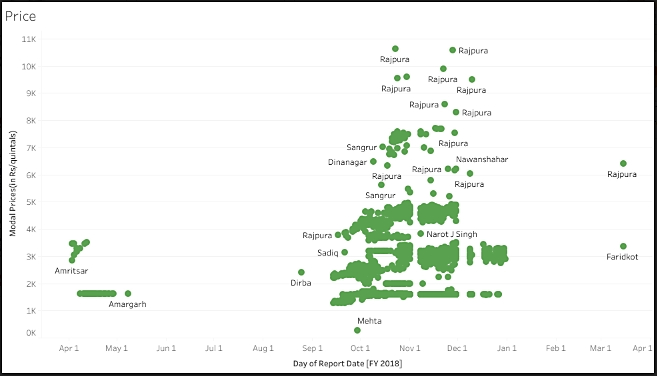
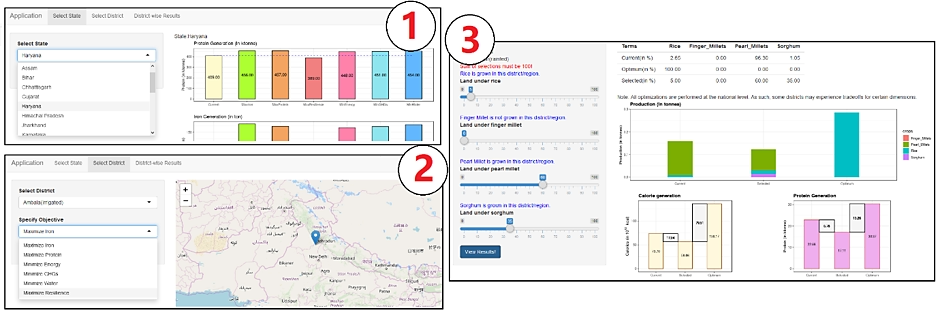
Do the union and state governments procure all #crops under the possession of farmers after the #harvest is over? The answer is, No. The #farmers are left with certain quantities of crops even after the procurement. They approach unregulated markets to sell these extra quantities. But at what price do they sell it? This sale price is known as the market price which is determined by demand and supply. The market price can either be above or below the Minimum Support Price (MSP).

MSP is the protection price which is estimated by the Commission of Agriculture Cost and Prices (CACP) taking into consideration all costs involved in the production of a crop. Any sale which happens at a price less than the MSP may cause monetary loss to the farmers.

Bhavantar Bharpayee Yojana is a compensatory scheme that was launched by the state government of #MadhyaPradesh in 2017. Bhavantar means the difference in value and Bharpayee means compensation. Under this scheme, the government does not procure crops, but it compensates the farmers in case there is a difference between the MSP and the market price.

Recently, the state government of #Haryana also implemented this scheme for compensating the farmers who grow #millets. The MSP of #bajra (pearl millets) for the Kharif Marketing Season (KMS) was declared at Rs 2250 per quintal in 2021. There has been a steady rise in the MSP for bajra since 1998    https://tinyurl.com/yjxb7exn

Sources in the Haryana state government say that the current market price of bajra has come down to Rs 1650 per quintal. This made the state government fix the compensatory price of Rs 600 per quintal under the Bhavantar scheme. It needs to be noted here that the government of Haryana allocated Rs 10 crore in the 2021-22 state budget.

Explore more datasets and make interesting #visualisations on www.indiadataportal.com (- by Sridhar Kundu)

#kharif #millets #bajra #bhavantar #haryana #MSP #CACP #BhavantarBharpayeeYojana #MinimumSupportPrice #pearlmillets

Bharti Institute of Public Policy Indian School of Business Ministry of Agriculture & Farmer’s Welfare, Government of India Chief Minister's Office, Haryana Chief Minister of Madhya Pradesh Press Information Bureau - PIB, Government of India DD Kisan Haryana Kisan & Agricultural Costs and Prices Commission/Haryana Kisan Ayog

#IDPInsights

Public mobility in times of COVID

Data from Google Mobility Report across India for parks https://tinyurl.com/ygokak53 and public stations https://tinyurl.com/yfyspduz, the newest addition to the IndiaPulse@ISB portal, shows that footfalls in public places which were at their lowest during the first lockdown, have bounced back to the pre-pandemic levels for most of the northern and central states of India, like Uttar Pradesh, Uttarakhand, Haryana, Madhya Pradesh, Odisha, Jharkhand, Rajasthan and Chhattisgarh.

The southern states, however, show a much lower level of mobility https://tinyurl.com/yfkppu96 as compared to their northern counterparts, as almost all of them were in the negative territory, except for Kerala and Tamil Nadu, in mobility trends for parks for July 2021 https://tinyurl.com/yf9za8mg.

Mobility data depicts the percentage gap in footfall in public places when compared with the baseline period. A baseline period represents a normal value which is calculated by taking the median value from five weeks, in this case from January 3 to February 6, 2020.

With the recent surge in COVID cases, and the Delta variant being responsible for the most number of cases in six of the eight north-eastern states, these states have recorded the lowest levels of mobility-- Public stations: https://tinyurl.com/yfe9c6vb and parks: https://tinyurl.com/yehptycw.

Compared to the last year, the top four states by the highest Gross State Domestic Product – Maharashtra, Tamil Nadu, Uttar Pradesh, Karnataka scored higher data points on Google Mobility. This shows that these states contributed to India’s economic recovery as hubs for economic activity. Public stations:  https://tinyurl.com/yg7afev5 and parks: https://tinyurl.com/yz9thwz7.

Explore more datasets and make interesting #visualisations on www.indiadataportal.com/IndiaPulse (- by Atif Zeya)

#IDPInsights

What is MSP? And the contentious issue of Sugarcane MSP

Minimum Support Price (MSP) is an insured amount that is declared by the Union Government before a harvest season for certain crops. It aims to protect the farmers in case of a fall in market prices due to bumper harvest of crops.  

Over the last 20 years, there has been a steady rise in the MSP of sugarcane. In 1998, the MSP for sugarcane was Rs 52 per quintal. Between 1998 and 2008, the growth in MSP was rather slow. Since 2009, the rate of growth in MSP has been relatively higher. In 2018, the MSP reached Rs 275 per quintal https://tinyurl.com/yghaf62g. In 2020-21, the MSP for sugarcane increased to Rs 285 per quintal.  

The MSP declared by the government sets the floor price for sugarcane all over the country. Farmers would get a price for their sugarcane produce not below this floor price. This floor price is uniform across states; however, production cost varies across states https://tinyurl.com/ygp2k289.  

Owing to the differences in production costs, the state governments declare an additional price that is applicable within their respective states. This price is known as State Administrative Prices (SAP). The SAPs are set at about 5 - 10 per cent above the floor price i.e., MSP.  

Recently, the Haryana government raised the SAP by Rs 12 per quintal, and the Uttar Pradesh government is likely to follow in the footsteps of Haryana in raising SAP for sugarcane in the state.

Explore more datasets and make interesting visualisations on www.indiadataportal.com (- by Sridhar Kundu)

#IDPInsights

Literacy and School Infrastructure in India

Every year, on 8th of September, the global community celebrates the “International Literacy Day” to raise awareness on the significance of literacy as a matter of self-esteem and for the advancement of literacy agenda in the creation of a more livid and sustainable society.” (UNESCO). However, as the world is advancing towards rapidly changing scenarios with new issues and challenges in the form of climate change, COVID-19 pandemic, economic slowdown etc., it is necessary the process of providing formal school education should remain fundamentally continuous, and widespread, so as to prepare students to cope up with evolving challenges.

According to the Primary Census Abstract (2011), states like Kerala, Goa, Mizoram and Tripura top the rank in terms of literacy rate, with 84.22 per cent, 79.91 per cent, 77.30 per cent, and 76.34 per cent respectively while states like Rajasthan, Jharkhand, Arunachal Pradesh, and Bihar rank the lowest with literacy rate at 55.84 per cent, 55.56 per cent, 55.35 per cent, and 50.44 per cent respectively (Figure 1).

The presence of an educational institution plays a significant role in the overall development of children, be it in terms of knowledge building, character enhancement or physical advancement, and for this, urban areas in India are leaving no stone unturned in ensuring that children are provided continuous education. But, are we ensuring the same benefits for children of rural areas?

According to the Mission Antyodaya Survey (2019), 77.57 percentage of villages in India are having facilities of primary schools (Figure 2). States like Gujarat, Mizoram and Kerala are having the highest presence of 97.84 percent, 97.14 percent, 95.55 percent respectively, while Manipur, Himachal Pradesh and Arunachal Pradesh have the lowest presence of 56.77 per cent, 44.36 per cent, and 39.15 per cent respectively (Figure 3) (Figure 4).

However, when it comes to continuing the process of education, the scenario changes. Only 39.19 percentage of villages in India are having the presence of middle/secondary schools (Figure 5), where states like Kerala and Mizoram continue to maintain the highest presence at 90.35 percent and 84.37 percent respectively. Majority of the villages in other states have less than 50% presence of secondary schools (Figure 6) (Figure 7).

Similarly, for higher/senior secondary schools, the figures reduce drastically. Only 10.77 per cent villages in India have the presence of senior secondary schools (Figure 8). Apart from Kerala (74.62 percent of villages), not more than 30% of villages of other states have presence of higher/senior secondary schools. (Figure 9) (Figure 10).

The reasons for negligence on the continuation of education for school children in rural areas can be infinite, but the question remains dominant: Are we really putting significant efforts in providing a continual education for rural population, which constitutes 72.4% of the workforce for Indian Economy?

(Note: The percentage values are derived from India Data Portal indicator tool by dividing the number of schools in the villages with the number of villages where Mission Antyodaya survey was conducted)

#IDPInsights

India’s economy largely unaffected by second wave of COVID19

The 2nd wave of #COVID19 in #India had a devastating impact on the lives of its citizens but its impact on #economy remained muted as compared to the 1st wave.

Various high frequency indicators (HFIs) on IndiaPulse@ISB portal like #electricity supply, #petroleum consumption, two-wheeler registration, #digitaltransactions data, #company registration, e-way bills show that the economic impact of 2nd wave was not as severe as the 1st wave.

Company registration data for states which are currently recording maximum number of COVID cases (#Kerala, #Maharashtra, #Karnataka, #TamilNadu) shows a slight dip in April 2021 but swiftly recovered in June 2021 https://tinyurl.com/yejr5kdx. Electricity supply which was at its lowest in June 2020 i.e during the 1st wave shows resilience in the 2nd wave https://tinyurl.com/ygvdytmz. However, the two-wheeler registration almost dipped to the level recorded during 1st wave, eventually recovering slightly in June 2021 https://tinyurl.com/ydoazguj.

All-India level Indicators like e-way bills https://tinyurl.com/ygvq3958 and #LPG consumption https://tinyurl.com/ye48rshw recorded a similar trend except for the digital payment indicator (which shows the volume of digital transactions like NEFT, RTGS, IMPS etc) https://tinyurl.com/ykypadaj which remained resilient during the 2nd wave has also increased over the past few months.

The key to sustaining the economic recovery will depend on how India will contain the risk of a third wave https://tinyurl.com/yg4cqwgo, while accelerating #vaccination https://tinyurl.com/yjza7dxv.

Explore more datasets and make interesting #visualisations on www.indiadataportal.com (- by Atif Zeya)

#IDPInsights

Farmers in Barmer gaze at the sky like ‘The Hawk in the Rain’

The farmers wait for rain every year in Barmer, Rajasthan; perhaps, they pray to the God of Rain for a good monsoon before their crops become lifeless.

One of the major crops cultivated in the district is bajra, which thrives on rainfed water (Fig 1) and is most suitable for the arid agro-climatic condition of this region where 82 per cent of the cropland remains unirrigated. Historically, bajra shows high volatility in production from a high of 5.75 lakh tonnes to a low of 5808 tonnes in a given year (Fig 2).

Uneven rainfall not only has a cascading effect on the produce (Fig 3) but also affects the ability to pay back the agricultural loans that the farmers have taken from banks or the institutions due to a bad crop year. Large and medium farmers (both by size and number of holdings) are the dominant cultivators of this crop (Fig 4 & 5) and are the highest recipient of agricultural credit.  


The other forms of aid are through direct benefit transfers (DBTs) and Pradhan Mantri Fasal Bima Yojana (PMFBY) under which the farmers of this region and state get benefits. 

Under the PM Kisan Scheme farmers of Barmer district represent 4.92 per cent of the total farmers of Rajasthan (Fig 7 & 8) and show a declining trend in DBT for each instalment from first through third. The PMFBY can take away the rainfall and agro-climatic risk that the farmers face every year, mimics a downward slope in terms of coverage from 2017 to 2019 in the state of Rajasthan (Fig 9). The risk of borrowing becomes high when there are higher chances of default, and agricultural credit has also taken southward hit over the years by the prime lending institution in the district (Fig 10).  

Explore more datasets and make interesting #visualisations on www.indiadataportal.com (- by Amrita Chakraborty)

#IDPInsights

Indian trade shows resilience amidst COVID19 

Data from the Reserve Bank of India (RBI) shows that India’s cumulative merchandise export value during April 2020-March 2021, dipped by 3.1 per cent to Rs 21.5 lakh crore as compared to Rs 22.2 lakh crore during April 2019-March 2020 https://tinyurl.com/yene33ds. Imports during the same period contracted by 13.6 per cent to Rs 29 lakh crore as compared to Rs 33.6 lakh crore during 2019-20 https://tinyurl.com/ygry6wtj. This reflects a strong recovery despite the lockdown during the early months of FY 2020-21.  

The strong recovery is also evident by the fact that exports for the month of March 2021 touched a record high of Rs 2.5 lakh crore for the first time ever in a single month. 

Value of oil exports (inclusive of oil products) declined by 35 per cent to Rs 1.9 lakh crore during FY 2020-21 as compared to Rs 2.9 lakh crore during FY 2019-20 https://tinyurl.com/yhfbj7n6.  This significant decline in India’s oil exports can be attributed to the fact that the petroleum demand had hit an all-time low due to COVID19 related lockdowns across the world. Oil imports in the same period contracted by 34 per cent, mainly on account of a decline in oil prices https://tinyurl.com/ye5leco8

The merchandise trade deficit for April 2020-March 2021 stood at Rs (-)7.5 lakh crore as compared to the deficit of Rs (-)11.4 lakh crore in April 2019-March 2020 https://tinyurl.com/yejsyqwa.

Remarkable recovery after a huge downturn shows that India’s trade performance remains resilient despite the disruption caused by the pandemic. 

Explore more datasets and make interesting #visualisations on www.indiadataportal.com/IndiaPulse (- by Atif Zeya)

#IDPInsights

Padhega India, Tabhi Toh Badhega India

Why does the Net Attendance Ratio (NAR) come down as the level of education increases?  https://tinyurl.com/ydqvjxub

NAR is the ratio of population in a specified age group (official age of enrolment as declared by the government) currently attending an education institution and total population in the same age group. It is different from Gross Attendance Ratio (GAR) for including people belonging to non-specified age groups in the numerator. 

According to the NSSO 74th round, Household Social Consumption Survey on Education, 2017-18, NAR at primary level was 86 per cent. At upper primary level, this ratio came down to 72.2 per cent. Further, as the level of education rises, the declining trend continues. Both at the secondary and higher secondary level, this ratio was 57.6 per cent and 43.4 per cent respectively. Again, at post higher secondary level, the NAR came down to 19.4 per cent. Several factors may be responsible for this declining trend. A few of them are: 

First, poverty could be one reason behind this declining trend. According to NSSO 68th round, 2011-12, about 25.7 per cent of population lives below the poverty line. In rural India, this percentage is higher (29.7 per cent) compared to urban counterpart (15.9 per cent). This poverty ratio is estimated using Tendulkar methodology of determining poverty line i.e., per-capita consumption expenditure of Rs. 27 in rural areas and Rs. 33 for urban areas. Higher level of education is less affordable for majority of the families living below and marginally above the poverty line. 

Second, in rural areas, number of villages connected to educational facilities declines as the education level rises. According to Mission Antyodaya Report, 2019, about 5 lakh villages have primary schools whereas, only 2.5 lakh villages have middle schools. About 1.2 villages have high schools and only 0.7 lakh villages are connected with higher secondary schools https://tinyurl.com/yglozzwy.

Explore more datasets and make interesting #visualisations on www.indiadataportal.com (- by Sridhar Kundu)

#IDPInsights

Puri in Odisha has become the first city in #India to provide safe drinking water to every household. The state government achieved this feat under the #Sujal Mission. The Sujal mission was started in 2020, with an objective to provide all households in urban areas with a supply of drinkable quality piped #tapwater.

Safe drinking water is as important as food for a healthy life and its provisioning is a priority for every government. It is, of course a time to rejoice the efforts of the #Odisha government which has been able to do this in at least one city. However, looking at the demography, its spread and the diversity of the state it has many miles to go.

According to Census 2011, about 17 per cent of people in Odisha stay in urban areas, compared to an all-India level of 31 per cent. The city of #Puri inhabits only 3.5 per cent of the total #urban #population in the state.

Along with the cities, the Odisha government has a major challenge in provisioning of drinking water supply in villages. According to #MissionAntyodaya Report 2019, about 51 per cent of the villages, which is about 25,000 villages in the state, are not connected with piped tap water supply https://tinyurl.com/yf4se5gg.

Districts of #Mayurbhanj, #Kalahandi, #Kandhamal and #Rayagada alone constitute approximately 7000 villages, which is about 29 per cent of total villages where not a single habitation is covered with piped tap water supply https://tinyurl.com/yjfqqxeu.

Explore more datasets and make interesting #visualisations on www.indiadataportal.com (- by Sridhar Kundu)

#IDPInsights

Sunflower not so sunny now: The declining production of sunflower in India

Sunflower also known as “surajmukhi” is an important crop for production of sunflower oil which plays a key role in food industry. India ranks 18th on the global ranking in terms of sunflower production but the sunny days of sunflower production in India are losing their shine.

According to the APY (Area Production Yield) data from the Ministry of Agriculture, there has been a constant decline in the production of sunflower from 11,00,000 tonnes in 2005 to 1,67,000 tonnes in 2017 (https://tinyurl.com/y6ygsq32). The decline is also seen in the area of cultivation (https://tinyurl.com/y6krc8bu).

Top 3 sunflower producing states - Karnataka, Andhra Pradesh and Maharashtra have experienced a continuous decline in the production at the rates of 77.4 per cent, 97.07 per cent and 89.97 per cent respectively from 2005 to 2017 (https://tinyurl.com/yym6xcmj).  

Farmers are not willing to cultivate sunflower because they tend to get lesser return on the market price (https://tinyurl.com/yeej5mqu) as that is somewhat similar to the cost of cultivation (https://tinyurl.com/yzghlvtu).

Although to boost sunflower production, government has increased the minimum support price from ₹ 10,000 per tonne in 1998 to ₹ 58,000 per tonne in 2020 (https://tinyurl.com/yz2vcktz). However, the government procurement is only 25 to 40 per cent of the produced quantity at MSP thus forcing farmers to sell the remaining quantity to private players at cheaper rates.

Lower production of sunflower has resulted in bulk imports of edible oil from other countries at a very high price which in turn has led to increase in food inflation.

Explore more datasets and make interesting #visualisations on www.indiadataportal.com (- by Danish Ali Hakim)

#sunflowers #msp #imports #inflation #productivity #farmers

#IDPInsights

Is #Kerala heading towards becoming a non-agricultural state?

If we look at the historic trends of the state of #agriculture in ‘God’s Own Country’ then the answer would be a probable ‘yes’.

In 2011-12, share of agriculture and allied sector in the state’s gross state value added (GSVA at 2011-12 constant prices) was 13.2 per cent which came down to 7 per cent in 2019-20. The diminishing share of agriculture and allied sector is supported by the declining trend of #food #production in the state.

Food production, which includes both #cereals and #pulses witnessed a secular fall during 1996-97 and 2016-17 https://tinyurl.com/yjq6tjvw. During the same period, total area allocated for food production followed a similar trend https://tinyurl.com/ygkdhoeq.

In the recent past, the state has witnessed a continuous shift from food crops to non-food or cash crops. This shift has also contributed to the declining of land area under the food crops. In 2016-17, the area under cultivation of #oilseeds constituted about 58 per cent and for cereals, it was about 13 per cent. Other crops which were cultivated in agriculture field were #spices (10 per cent), #drugs and #narcotics (7 per cent), #vegetables (5 per cent), #fruits (4 per cent) and dry fruits (4 per cent) https://tinyurl.com/yhmorzvn.

Food is an essential commodity. Cash crops, no doubt provide easy cash to the farmers and might earn them more profits as compared to other crops. But declining food production may make the state overdependent on others for food. At a time, when inter-state fights on various issues are emerging, it is important for each state to become self-reliant on food.

Explore more datasets and make interesting #visualisations on www.indiadataportal.com (- by Sridhar Kundu)

Road-connectivity in #rural #India remains a major challenge. There are about 6.5 lakh villages where about 70 per cent of the total population of country lives. About 30 per cent of villages which is approximately 2 lakhs, do not have all-weather-roads (Mission Antyodaya, 2019 Report).  

An all-weather road as defined by the Indian Roads Congress is a road which is negotiable in all weathers, except at major river crossings. Presently, many villages have kutcha roads which are not even good for riding a 4-wheeler vehicle. During the rainy season, situation becomes even worse. It is difficult for an ambulance to enter a village in case of an health emergency.  

India receives about 80 per cent of its total annual rainfall during #monsoons. Most of the rivers are flooded with rainwater and villages remain cut off from the mainland and market centers. Incidence is relatively high in the poorer states like Bihar and Uttar Pradesh.  

According to #MissionAntyodaya 2019 report, districts like #Muzaffarpur#Araria, #Kishanganj in Bihar have less than 10 per cent villages with all-weather roads (figure 1). Uttar Pradesh has a similar situation in about 22 districts (figure 2). 

Pradhan Mantri Gram Sadak Yojana (#PMGSY) launched on 25 December 2000, aimed at providing all-weather road access to eligible unconnected habitations with population of up to 500 in the plains and 200 in the hilly regions. There is need to put in more efforts to provide road access to each village of India.  

Explore more datasets and make interesting #visualisations on www.indiadataportal.com (- by Sridhar Kundu)

#IDPInsights

It is imperative to become #food self-sufficient. Since macro-economic reforms in 1991, government policies on #agriculture are largely centered around increasing #production and #productivity. Inequality in agriculture though a pertinent issue, is hardly discussed and debated.

#Land is a primary input in the production process. Total land area (holdings area) used for agriculture in 2010 was 159.5 million hectares and in 2015 it was little less about 157.8 million hectares (AgCensus 2010, 2015). The main issue is that that larger share of agricultural land is concentrated in few hands, although the skewness in the land distribution has witnessed a marginal diminishing trend since 1970.

In 2010, less than 5 per cent of total landowners, mostly large and medium farmers, owned about 32 per cent of total land area used for agriculture (Figure 1- https://tinyurl.com/yjtt6qxf and Figure 2- https://tinyurl.com/ygx87chw). In 2015, a similar percentage of farmers owned about 29 per cent of the total agricultural land (Figure 3- https://tinyurl.com/yg4dutyv and Figure 4 - https://tinyurl.com/yfvwt9ua) while in 1970, the total agricultural land owned by large and medium farmers was about 60 per cent.

Large farm size facilitates use of modern techniques and contributes to productivity and a higher concentration of land also helps a few to capture a larger market share through their surplus production. Farmers with larger land area also accumulate a bigger share of benefits under various government schemes. This again widens the degree of #inequality.

Explore more datasets and make interesting #visualisations on www.indiadataportal.com (- by Sridhar Kundu)

Bharti Institute of Public Policy Indian School of Business Ministry of Agriculture & Farmer’s Welfare, Government of India Indian Council of Agricultural Research NITI Aayog Ministry of Rural Development, Government of India DD Kisan

#farming #farmers #sustainability #economy #environment #development

#IDPInsights

How safe people in rural areas are during #monsoons? According to Socio-Economic Caste Census (SECC) 2011, about 27.2 million families in #rural India live in one-room house which is made up of clay and sand. The rooftop is made of either grass, leaves or other related materials. Some rooftops are also covered with plastic material or polyethylene.

More concentration of these rural households is found in #Bihar, #WestBengal, #MadhyaPradesh, #UttarPradesh, #Odisha and #Rajasthan. These six states constitute above 70 per cent of the total rural households with one-room kutcha house. In Bihar, about 7 million rural households are in this condition, followed by 3.3 million in West Bengal and 2.8 million in Madhya Pradesh. In Odisha, about 2.3 million families in rural areas stay in one-room kutcha house https://tinyurl.com/yjegxz6j

In the month of July, on an average Bihar receives above 400 mm rainfall whereas, Odisha, West Bengal and Madhya Pradesh receive about 300-350mm rainfall (Rainfall Statistics, 2019). The kutcha houses are not safe during rains. Winds sometimes blow away the rooftops and then, rainwater spoils the clay floor and makes the whole place unlivable. The outcome would be that a family of five including young children are forced to move out and live either in their neighbours’ corridors, or shift location and then wait for the monsoon to end. Several government initiatives like Indira Aawas Yojna (IAY), Pradhan Mantri Aawas Yojna – Gramin (PMAY-G), have been undertaken to improve rural housing. Hopefully, the next #Census would show us a brighter picture of the rural #India.

Explore more datasets and make interesting #visualisations on www.indiadataportal.com (- by Sridhar Kundu)

#IDPInsights

Who says #barter economy does not exist? Visit a weekly or bi-weekly haat (market) in a village where one will come across people who are able to get some items for their homes in exchange for home-made paper bags, pickles, masalas, badis, mahua, tadi (local drinks) etc and in some cases, human labour is also bartered.  

In villages, most farmers belong to small and marginal category. Their produce is inadequate to be sent to mandis for selling. Since agriculture is the primary occupation, they have less cash in hand for their children’s education, health, expenditure on marriages etc and here weekly #haats provide them with feasible options. 

Haats are the major centres to meet rural demands. Besides, agri-commodities, animals like cattle are also sold and purchased in these markets. Farmers can buy seed varieties, fertilisers, manure etc according to their resource size and requirements and haats are the best places for information gathering, communication and dissemination.  

Weekly haats serve as a lifeline for many villagers. According to #MissionAntyodayaSurvey2019, about 95,000 villages have weekly haats whereas about 4.95 lakh villages don’t have one. A weekly haat in any village attracts people from its periphery villages as well. It is also not surprising to see that there is higher concentration of weekly haats in states like #UttarPradesh, #Bihar, #Odisha and #Jharkhand https://tinyurl.com/yzyfmzoq and https://tinyurl.com/yz8p5emw. Figure 3 https://tinyurl.com/yzd4wr6o shows us district-wise distribution of weekly haats where #Mayurbhanj (#Odisha), #Vishakhapatnam (#AndhraPradesh), #Dumka (#Jharkhand), #Medinipur East and West (both in #Bengal) have the highest number of #villages

Economic growth in #India is mostly demand driven. Due to COVID19 pandemic, where the growth shows a downward trend, the weekly haats may help contribute to growth recovery through its rural demand generating capacity. 

Explore more datasets and make interesting #visualisations on www.indiadataportal.com (- by Sridhar Kundu)

#IDPInsights

Supply creates its own demand. This is the famous Say’s Law from the nineteenth century. The validity of this law was rejected by many Keynesians during the twentieth century through empirical evidence. Even today, this law has less significance as it has overlooked unforeseen circumstances like the lockdown as a result of COVID19.

Flowers are in huge demand at homes, in temples and other places of worship. Its demand multiplies during marriages, festivals and other occasions. Because of COVID19 pandemic since early 2020, temples have been closed and there are fewer ceremonies during marriages and other  social activities where flowers are predominantly used for decorations. This has led to a sharp fall in the demand for flowers.

However, flower production continues. It is a cash crop and farmers produce it with the aim to have more cash in hand. The declining demand for flowers has economic implications on the farmers who grow this crop. Importantly, over 63 per cent of farmers who grow this crop every year belong to small and marginal categories (visualisation 1: https://tinyurl.com/ykxr3go2). Any crop produced by farmers belonging to this category has a direct correlation on their livelihoods as it is their major source of income.  Tamil Nadu, Karnataka, Maharashtra, West Bengal, Andhra Pradesh have the highest acreage for flowers (visualisation 2: https://tinyurl.com/ygyyxje9).  Unlike paddy, pulses and others, flower crops attract less compensation. Visualisation 3: https://tinyurl.com/ygub6sfz  shows state-wise cultivation area for flower crops by different categories of farmers.  

Explore more datasets and make interesting #visualisations on www.indiadataportal.com (- by Sridhar Kundu)

#IDPInsights

Have the achhe din arrived for Indian farmers? The Government of India (GOI) recently declared new MSP for #kharif crops. Accordingly, paddy’s #MSP has increased by 4 per cent, from Rs 1868 in 2020-21 to Rs 1940 in 2021-22. There are many reasons for the new MSP and rise in fuel prices could be one of them. 

Retail prices of petrol and diesel have increased by over 30 per cent from the previous year. These fuels are used in pumpsets used for #irrigation and other machines used for #agriculture starting from production to the market stage.

Statistics from Department of Agriculture say that both operational costs on irrigation and use of machine constitute about 20 per cent of the total cost of #paddy cultivation, though it varies from state to state. In #UttarPradesh, irrigation alone costs more than 10 per cent of the total costs. In #Chhattisgarh, operational costs due to use of machines is about 16 per cent of the total costs.  As a result, rise in fuel prices could raise the input costs of paddy by about 6 per cent, which is about 2 per cent above the recent hike in MSP for paddy. 

Explore more datasets and make interesting #visualisations on www.indiadataportal.com (- by Sridhar Kundu)

Country Fiscal Measure - Additional spending and foregone revenue in response to Covid-19

Visual depicts the fiscal measure by way of Additional Spending and Foregone Revenue in response to Covid - 19 (as % of GDP) of the four most affected Covid-19 countries. The four countries (USA, Brazil, India and Russia) have the highest number of Confirmed cases as on July 10, 2020 (Johns Hopkins Medicine Coronavirus Resource Centre). The fiscal measure data as of June 12, 2020 reveals the support provided is highest in USA (12.28%), followed by Brazil (6.53%), Russia (1.9%) and India (1.2%)

Construction Sector Growth in India

The share of construction sector in India’s GDP witnessed a steady decline since 2011-12, possibly because of lower and fluctuating growth. In 2019-20, the sector achieved a growth rate of 1.3%. Growth in this sector is employment elastic, estimated to be 1.1 (RBI,2014). Lower growth is a worrying factor looking at its ability to generate employment opportunities for the mass unskilled labour force in the country.

Temporal analysis of Cyclonic Storm in the Bay of a Bengal

Recurrent cyclonic storms in the Bay of Bengal have inflicted massive losses in the coastal regions of Bangladesh and India (particularly Orissa and West Bengal). The time series visual from 1950 to 2016 asserts that the area has witnessed around 87 storms, with intensity ranging from 35 to 140 kt in the last 66 years. The darker areas of the visual indicate greater intensity of storms which is seen to be on the rise.

India has 4th highest Covid-19 cases in the World

Visualisation represents growing trend of Covid19 cases across the world as on Jun 11 '20. USA leads the chart with 20,20,000 confirmed cases & 1,13,820 deaths. Whereas India ranks 4th surpassing UK with 2,97,535 confirmed cases and 8,498 deaths.

Data Source: https://lnkd.in/enC4_av

Death & Recovery Rate of top 5 Covid-19 affected states

The visual depicts the death rate and recovery rate of top five most affected Covid-19 states of India as on June 14, 2020. Maharashtra tops the chart with highest number of total confirmed cases followed by Tamil Nadu, Delhi, Gujarat and Uttar Pradesh. Also, it could be observed that Delhi and Maharashtra have both the measures unfavourable when compared to national average, thus making them the worst hit states of India.

Source: Ministry of Health and Family Welfare, Government of India

Quarterly GVA 2019-20

The visual depicts quarterly estimates of Gross Value Added (GVA) at Basic Prices for 2019 (at 2011-12 prices) and percentage change over previous years’ quarters, consolidated and across eight key sectors of economic activity. Since the lockdown was announced during the last week of March, therefore its major impact is expected to be felt in the first and the subsequent quarters of 2020. It is observed that Indian economy was already facing a slowdown since the first quarter of 2019 YoY and the same trend continued till the last quarter. The months' long lockdown with restrictions on both demand and supply side additionally stressed the economy. Stimulus in the right direction is the required urgently to revive it. Source: Press note on provisional estimates of annual national income 2019-2020 and quarterly estimates of gross domestic product for the fourth quarter (q4) of 2019-2020, Ministry of Statistics and Programme Implementation, Government of India, May 29, 2020. 

Source:  Press note on provisional estimates of annual national income 2019-2020 and quarterly estimates of gross domestic product for the fourth quarter (q4) of 2019-2020, Ministry of Statistics and Programme Implementation, Government of India, May 29, 2020.

Investors’ Sentiment in Indian Economy on the rise of Covid19 Cases

Covid19 adversely affected Indian economy within a month of its rise. Sensex tanked to 18% from Mar 2-Apr 24 with rising cases. Market touched a 2 year low on Mar 23, anticipating a lockdown. Economy may get back on its feet with Special Economic Package announced by Prime Minister of India.

Covid-19 impact on International Trade

Covid19 has gravely affected all sectors of the Indian economy, including international trade. As per the provisional estimates of RBI in April'20 exports exhibited a negative growth rate of (-)56.39% and imports registered a negative growth of (-)54.59% Y-O-Y. Downfall in exports is attributed to global economic slowdown, worsened by Covid19. On the other hand, imports shrunk due to large scale disruption in global supply chains and increased cancellation of orders. Export items severely affected are: gems & jewellery, leather and leather products, handicrafts; and worst affected import items are: electronic goods, petroleum crude & products, machinery, electrical and non-electrical. A revival package along with direct fiscal reforms is needed to protect the employment-intensive export sector.

Covid-19 curve in India

Nations across the world are striving hard to flatten the curve of Covid-19. For the same, India observed nationwide lockdown since March 25 and recently lifted few restrictions in its third phase.  Given the hard dichotomy prevailing before the governmnet - between the economy revival and public health safety, the panedemic curve does not seem to flatten in Indian circumstances as the cases on a given day are more than the previous day. The graph below depicts the 5-day moving average of the Covid-19 cases till May 8, 2020. It could be clearly observed that the curve of Indian Covid-19 cases is witnessing an upward trend. Alongwith this, the animated visual depicts the daily Covid-19 cases.

Source: Ministry of Health and family Welfare, Government of India (As updated on May 8, 2020)

NGOs role in figuring Covid-19

The laborious effort of frontline workers-Doctors, Paramedical Staff, Public Administrators, Police Forces in battling the deadly virus 24X7 is worth applauding. This list is incomplete and rather delusionary if the role of NGO’s is undermined. The depiction attempts to highlight the contribution of NGO’s vis-a -vis state government in feeding people during lockdown. More so, in 13 states the NGO’s have outperformed the state Government. Not only food, but NGOs have also provided relief or shleter homes to the needy poople affected by Covid 19 lockdown (Mostly including stranded migrant labourers). Apprised of the laudale efforts of NGOs, the Centre has entitled them to receive grains from the district administration or Food Corporation of India at below market prices to feed the vulnerable sections. The need of the hour is to put similar collaborative efforts and work in synegy in dealing the crisis.

Source: Central Government Reply to Supreme Court on Response status in tackling Covid-19 (India Today, April 9, 2020)

Impact of Covid19 on cereal arrivals in market

Covid Impact on Agriculture: Agricultural mandis in many parts of the country are operational amid the nationwide lockdown, but the process is gradual, and disruption persists. This is clearly evident from the data from the Agmarknet.gov.in. Cereals are the basic food requirements for the people of the nation. But in the first 15 days of April, the arrivals in market of different type of cereals have considerably reduced as compared to the arrivals for the same time-period of last year i.e. 2019.

Under the Fifteenth Finance Commission Project

Progressive elimination of revenue deficit keeps the state governments consistent with fiscal sustainability. The figure shows the performance of the government of Punjab vis-à-vis the FRBM target for revenue deficit (2012-13 to 2016-17). The shaded area depicts the gap between FRBM targets and the actuals. There is observed convergence in the performance of the government of Punjab vis-à-vis the Fiscal Responsibility and Budget Management (FRBM) target for the year 2016-17; although the State was not able to reach close to the assigned targets in the previous years.

Source: CAG State Finances Reports (2012-2017)

Fifteenth Finance Commission

Disregarding the fiscal prudence norms, the State of Punjab has not been able to reach close to the assigned targets of Fiscal Deficit. In the year 2016-17, the Fiscal Deficit went abnormally high to (-)11.02 as against the FRBM Fiscal Deficit target of (-)3.0, this is excluding the additional borrowings of Rs. 57.69 Billion under UDAY scheme. If this amount is included, then it will drive Fiscal Deficit to a new high. This explains the widening gap between the receipts and the expenditure of the government.

Source: CAG State Finances Reports (2012-2017)

Fifteenth Finance Commission

A low value of outstanding debt to GSDP Ratio indicates that the state economy is vibrant to pay back debts without incurring further debt. The figure depicts the total outstanding debt relative to GSDP with respect to FRBM and budget targets. During 2011-12 to 2015-16, the government of Punjab successfully maintained the ratio of total outstanding debt to GSDP within the prescribed limit. However, post 2015-16, a very high value of 42.72% as against the FRBM target of 31.49%; reflects the imbalance in the fiscal prudence of the state. This can be majorly attributed to UDAY loan and Cash Credit Limit accounts. The increasing debt GSDP ratio may increase the possibility of the state falling into a debt trap.

Source: CAG State Finances Reports (2012-2017)

Rich states have higher districts in Orange & Red Zones

As of April 24th, 2020, India had 17610 active #Covid19 cases with 718 fatalities. We have another five days of complete country level #lockdown, yet there is lack of clarity of with what after May 3rd. Ministry of Health & Family Welfare has classified the country’s districts in three zones - Red, Orange and Green, based on the severity of outbreak and the number of cases in the area. A quick look at the numbers shows that the rich states have a higher number of orange and red zones with the exception of Maharashtra. Why?

Size of the bubble indicates state GDP per capita.

Case – Fatality Percentage

The Global Pandemic is taking heavy toll on human life and the world is grappling with a faceless enemy unperecedently. Below pictograph depicts the Observed Case-Fatality Ratio in Indian States-number of deaths per 100 confirmed cases; with Meghalaya on top. The data referred in the depiction is upto April 25, 2020.

Source: Ministry of Health and Family Welfare; (As on April 25, 2020).

Elderly (60+ Age) People in India

About 8.6 percent of total population in India are above the age of 60 (Census, 2011). According to World Health Organisation (WHO), older people are at highest risk from COVID 19 (WHO, April 2, 2020). In India, both the Union Government and State Governments are trying to fix the problem of spread of COVID 19 through various administrative measures and healthcare facilities in specific target zones. The target zones are identified through the relative concentration of virus infected people in a locality. As elderly people are more prone to this infection, the concentration of this population needs to be taken another indicator while specifying the target zones. In the states like Tamil Nadu, Kerala, Punjab, and Himachal Pradesh, above 10 percent of their population are of above 60. The governments in these states need to be more pro-active to contain the spread of COVID 19.

Figure 1. Share (%) of Elderly People (Above age of 60) in 6the total population of State/UT

Inflation and Lockdown

The Consumer Price Index growth rate hauled down to 5.91% in March 2020 (Year on Year basis); lowest since November 2019. However, the figures must be inferred with caution since the field work for price collection of Consumer Price Index (CPI) was suspended with effect from 19th March 2020 and about 66 per cent of price quotations were received (Reserve Bank of India, 2020). On the left side, the combined inflation rates (Rural and Urban) of different groups is indicated. Amid lockdown, projecting the prices is difficult given the severe shocks both on demand side and supply side.

Source: CEIC Data and Ministry of Statistics and Programme Implementation.

Covid-19 Affected Regions and Indians Diaspora

The depiction below exhibits the spread of the pandemic Covid-19 across the World Health Organization’s regional groupings with select countries comprising Indian Diaspora. The range signifies the timeline i.e.,  reporting  of the first confirmed case of infection and stretches till the first case of casualty (Both need not be the same). It could be clearly observed that China of the Western Pacific Region was the first nation to initiate the timeline; while the European region forms the largest region to report such incidents; and the African region last to join the league.

Source: https://ourworldindata.org/ (Data as Available on April 18; 2020)

Lockdown impact on Rural & Urban employment

The nationwide lockdown starting from March 25, 2020 has brought the economic activities to a standstill thereby impacting the job market. The unemployment levels both Rural and Urban have witnessed multiple jumps when compared to the figures of the previous year during same timeline. The unemployment rate represents the percentage of people who were looking for jobs but failed to find one. While the unemployment levels (both Rural and Urban) were higher even before the Lockdown announcement in last week of March when compared to the previous year; a significant increment of more than four times is observed in the first week of April (Week 14).

Source: Centre for Monitoring Indian Economy (Data range- March 1st week to Mid-April for the years 2019 and 2020)

Air Pollution (PM 2.5) in India pre & post the Covid-19 Lockdown

Air Pollution in India is a serious health issue. One of the prominent pollutants observed is PM2.5 . PM2.5 means the mass per cubic metre of air; containing solid particles and liquid droplets. The chief sources contributing to this pollutant are: Dust, Construction, Vehicles, Residential, Power Plants. The depiction here reveals the Air Quality Index of PM 2.5 of eight metropolitan cities of India from March 10, 2020 to April 7, 2020.

Source: The World Air Quality Index Project.

Covid19 Testing Centres Across Six Zones

With upsurge in Covid-19 infections; the government is attempting to scale up the testing facilities across all states in India. The depiction below throws a light on the current scenario of Covid-19 cases across six different zones (As updated on April 9, 2020) of India with corresponding number of testing centres available (As updated on April 7, 2020). 

Source: Number of Confirmed Cases- Ministry of Health and Family Welfare; Testing centres-Indian Council of Medical Research.

Health Infrastructure across Indian States

With the surge in Covid-19 cases, the pressure is ultimately building upon the health infrastructure across the states. One of the indicators of health services infrastructure is- Average population served per government hospital. The depiction reveals capacity variation across states.

Source: Central Bureau of Health Intelligence, National Health Profile, 2019.

Covid-19 Global Hotspots

Covid19 pandemic has now affected almost 8.5 lac people across the World and cases in the west are growing exponentially. It is emerging as one of the biggest Public Policy Challenge governments have ever faced. From complete lockdowns to general guidelines on social distancing, nations are using different approaches to tackle this pandemic. The pro-activeness and evidence based decision making approach can help save lives of billions across the world. Link here

Source : European Centre for Disease Prevention and Control

COVID - 19 Cases in India Post National Lockdown

Government of India is relentlessly working to Combat Deadly COVID-19. The National Lockdown in India seem to potentially work by slowing down the pace of infections; nevertheless, it will be too early to comment on the same and understand the impact of this policy intervention both on the health emergency as well as on the economy. Below we depict the pattern of the COVID-19 cases in the first week post National Lockdown.

Source : Ministry of Health and Family Welfare

Under the Doubling Farmers' Incomes Project

The data presents price fluctuations for apples from Himachal Pradesh in the FY 2018. Apple other than being a cash crop, is also important cultivable crop of the region. As many farmers in the area are engaged in cultivation of apple. This data from www.agrmarknet.gov.in represents how the wholesale prices of apple has changed over the time in FY 2018.

Doubling Farmers' Incomes Project

The data presented is from www.agmarknet.gov.in, for Jharkhand State and commodity tomato. According to the data, the prices of tomato rose maximum in August and especially in the markets of Khunti and Gumla. As per the data the maximum modal price was approximately 15,000 rupees per quintal, which in general trends used to be 3,000-4,000 rupees per quintal.

Doubling Farmers' Incomes Project

The data of agricultural markets was collected from the financial year 2013 to FY 2018. According to this data, all the markets which have reported even once in the tiome frame have been considered function. As a result of this, the gap between the blue bars and the bold black line shows the number of registered markets that don’t report data. With Bihar being one of the states which have highest number of non-reporting markets.

Doubling Farmers' Incomes Project

The black dots indicate the location of various fruits and vegetable markets in India while various shades of blue indicate irrigated land as per the label. One can easily observe areas with high market activity also having large areas of irrigated land.

Doubling Farmers' Incomes Project

The brown dots indicate the location of various fruits and vegetable markets in India. One can easily observe epicentres of high market activity. 

Doubling Farmers' Incomes Project

 Image shows price variation in paddy in Punjab for 2018.

Doubling Farmers' Incomes Project

Map showing the contribution of various states towards production of oranges.

Doubling Farmers' Incomes Project

 Image shows the commodities traded in a high income market - The Ravulapelem Market, which majorly trades in bananas. 

Doubling Farmers' Incomes Project

Graph showing fluctuations in the price of Onion in a month (Nov,2017), in Andhra Pradesh.

Under the Quality of Education in Punjab Project

The data is for 2018-19 and it represents performance of students in Punjab in government managed schools across different districts. Individual performance data is aggregated (median scores) at district level for mathematics and english scores for classes 5th and 8th.  

The data depicted shows ranks of all the districts in Punjab based on their share of students in class 5th performing better than median performance (72.5/100) in maths across all districts. Ferozpur, Fazilka and Roopnagar are the top three schools whereas Amritsar, Bhatinda and Tarn Taran are the worst ranking districts in mathematics for class 5th. The median performance (68.13/100) in english across all districts is 68.13/100. SBS nagar, Fazilka and Ferozpur are the top three schools whereas Amritsar, Bhatinda and Tarn Taran are the worst ranking districts in mathematics for class 5th

Quality of Education in Punjab Project

The data depicted shows ranks of all the districts in Punjab based on their share of students in class 8th performing better than median performance (53.75/100) in mathematics across all districts. Gurdaspur, Faridkot and Hoshiarpur are the top three schools whereas Bhatinda Moga and Barnala are the worst ranking districts in mathematics for class 8th.  SAS Nagar, SBS Nagar and Roopnagar are the top three schools whereas Bhatinda Moga and Tarn Taran are the worst ranking districts in English for class 8th

R Shiny Dashboard for optimum cropping patterns

Cereals form a significant fraction of the agricultural produce in India. However, the current cropping patterns are far from optimum in terms of energy utilisation, protein generation, resilience in the face of climate vagaries and water consumption. To bridge this gap, the authors of “Assessing the sustainability of post-Green Revolution cereals in India” have used historical data on agricultural yield and irrigation to generate optimum cropping patterns for four cereals -Rice, Finger Millets, Pearl Millets and Sorghum, on a nationwide scale. These optimum patterns correspond to six objectives: maximising protein, and iron, minimizing energy demand, water consumption, and generation of greenhouse gases, and maximizing resilience.

In order to facilitate the adoption of these optimized patterns, the authors have envisioned a Shiny dashboard. Through a simple 3 step selection process, the dashboard presents the current and optimum statistics at the state and district levels. The user can select a region of interest, generate a custom cropping pattern and compare it with current and optimum scenarios.

Price Fluctuations in Onion in Maharashtra, India in 2019

In 2019, India saw a steep rise in the onion price, even though it is one of the leading countries for production of onion in the world.
 
Maharashtra, a leading producer of onion, also experienced an exorbitant rise in onion price.  Typically, four varieties of onion are sold in market in Maharashtra – Local, Hybrid, Others & Colored. Across all these varieties, the price for “other” variety rose the maximum – to Rs. 31,825 per quintal in Nashik, the largest onion producing district in the country, during the fourth quarter of the year.

Though all varieties of onion saw an increase in price, however, the “other” variety was hit the most where it reached to Rs.31,825/- per quintal by the end of the year from Rs.1,125/- per quintal in first quarter.

Source: https://agmarknet.gov.in/

Night Light across India 2016-17

  • Night-light data, which provide a numerical measure of brightness of the earth during the night, is a direct result of human activities and hold enormous potential in economic analysis.
  • The data represents the state’s radiance value as a percentage of total radiance.
  • Among the major states in India, night lights activity was the highest in Uttar Pradesh (11.73), Rajasthan(9.47), Maharashtra (9.30) and Karnataka (6.96).
  • The radiance values are measured in units nanoWatts/cm2/sr.
  • To view the interactive visualization, please visit this link

Source: https://www.ngdc.noaa.gov/eog/viirs/download_dnb_composites.html#NTL_2015

Area, Production and Yield of cereals in India

The area harvested under rice and wheat increased by 26.2% and 136.7% respectively from 1961 to 2017 while the area harvested under Barley, Sorghum, and Millet declined by 79.5%, 67.9% and 51.2% respectively for the same period. The area under wheat was well below the area under sorghum and millet until 1970-72. The gap between the areas under rice and wheat has narrowed significantly since 1961. The production of wheat and rice has increased steeply by 795.8% and 215% while the millet production has increased by 49.6% from 1961 to 2017. These figures are consistent with the idea that green revolution in the late 1960s has displaced lower-yielding crops (millets, sorghum) and pulses with cereals with higher yield potential (rice and wheat).

Source : FAOSTAT

Area under production of Nutri Cereals in India

Total area covered under the production of Nutri Cereals such as Jowar, Bajra, Maize has witnessed a declining trend particularly during the post-green revolution period. Starting from 1950 to 1970s, the annual average area under production of nutri cereals was above 44 million hectares. Since 1980s, there is a steady decline in the trend and today, it stands at 24 million hectares which is around 50 percent less than the total area under production before 1980.

Source: Agriculture Statistics: At a Glance 2018, Department of Agriculture, Co-operation and Farmers Welfare

Aroma Mission

Aroma Mission is an initiative to improve the yield in aromatic plant cultivation such as Aloe Vera, Mehndi, Menthol, Mint etc. through new technology developed by Council of Scientific & Industrial Research (CSIR), Government of India. Total area covered under the cultivation of Aromatic Plants stands at 2.25 lakh hectare (AgCensus 2010-11).

Small and Marginal (< 2 hectares of land holdings)

Semi-medium (<5 hectares of land holdings)

Farmers are the dominant players in this sector. Together, they share about 71 percent of area under the cultivation of aromatic plants. The mission aims to increase their profitability through research and development.
 
Figure. Category wise distribution (%) of area under aromatic plant cultivation in India

Note: The visualisation is developed by using India Data Portal

Under the Forest Governance Project

This visualization shows countries recognizing tenure rights & percentage of people living in restoration area. The data is from 113 developing countries broadly across three continents viz. Asia, Africa and Latin America.

To see the detailed visualization, visit here:

Forest Governance Project

This visualization shows a list of Non-timber forest products (NTFP) collected by the villagers from 7 blocks in Korchi, Gadchiroli district, Maharashtra and provides information related to:

1.     The population, Number of Households, names of NTFPs collected from the forest, quantity used for either self-consumption by the villagers or sale along with the selling price.

2.     Further, it also shows the legally approved Community Forest Rights (CRF) area in these blocks and the year when they received the ownership title.

To view the complete visualization, click here

Source: Primary Data collection (ISB)

Forest Governance Project

Follow the link to interact with the visualization showing crop production statistics using: total area under crops at the State and District level, Total production & Yield.

Data Source: Directorate of Economics and Statistics, Department of Agriculture, Cooperation and Farmers Welfare, Ministry of Agriculture and Farmers Welfare, Government of India.

e-Registration in Maharashtra: Towards Improving State Finances

The Department of Registration and Stamps, Government of Maharashtra serves as a vital contributor in the State Revenue. In the year 2014;  the department rolled out its flagship e-Governance initiative of  e-Registration for registering Leave and License Agreements to facilitate the citizens to register anytime, anywhere; thereby overcoming the deficiencies in erstwhile legacy system. The depiction clearly corroborates the success of initiative in terms of revenue generation; which multiplied tremendously since the year of commencement.

Source: Department of Registration and Stamps, Government of Maharashtra, 2019